Overviews & Reports
Zoom: Detailed & Weekly | Workload per Person | Annual Overview | Planned vs. ActualZoom: Detailed & Weekly
Detailed
With the "Detailed" option, you can "expand" both the monthly and weekly views.
This makes the volume distribution more tangible and allows for more information to be displayed. For very small teams, the detailed view makes better use of the screen height.
 English image not yet available...
This makes the volume distribution more tangible and allows for more information to be displayed. For very small teams, the detailed view makes better use of the screen height.
English image not yet available...Weekly
Unlike the regular view, this displays the remaining hours per person per day.
Workload per Person
Get quick insights into workload and remaining capacity directly in your planning.
- Live display of workload for the next 4 weeks (monthly view) or the next 7 days (weekly view).
- Remaining hours (difference between Target and planned hours) per week (monthly view) or per day (weekly view).
 English image not yet available...
Settings
The live display can be disabled via "Select Teams" (click on the person icon at the top left).
By default, MOCO always shows the remaining hours when a person is under-planned or over-planned (< 80% or >120%) – otherwise, it appears only on mouseover. This display can be managed through the settings:
 English image not yet available...
By default, MOCO always shows the remaining hours when a person is under-planned or over-planned (< 80% or >120%) – otherwise, it appears only on mouseover. This display can be managed through the settings:
English image not yet available...Annual Overview
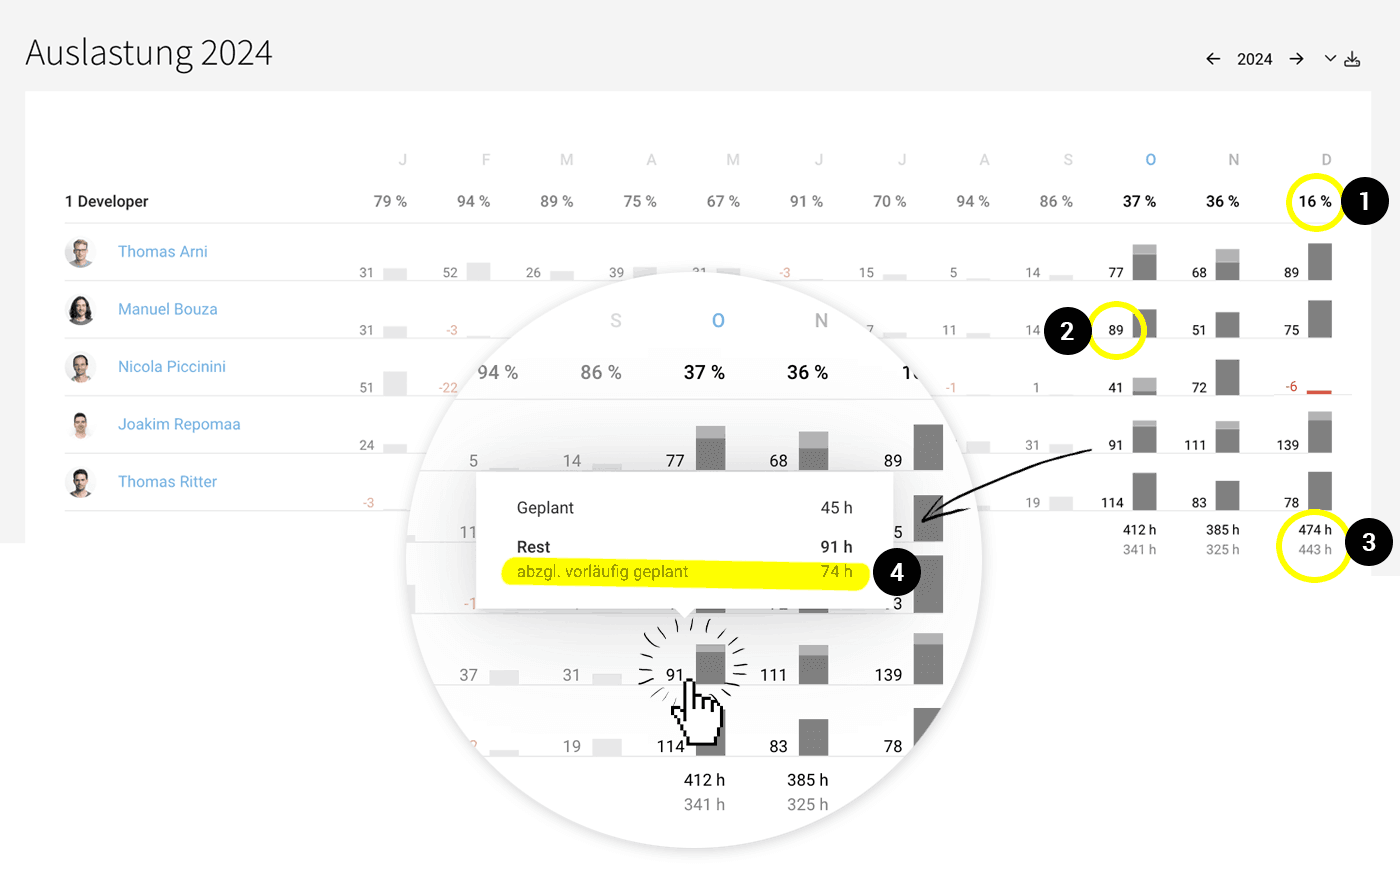
Reports > Planning
Overview of All Individuals and Teams for the Entire Year
MOCO displays the workload/capacity for the entire year across all teams and individuals. Here you can quickly see who still has capacity for new projects. Learn more
 English image not yet available...
English image not yet available...Planned vs. Actual
 English image not yet available...
Per Planning Entry (1)
Directly in the planning, you can see for past entries how many hours were actually worked compared to the planned hours.
Per Month and Person, Project, Client, Company (2)
In the company report, client report, project report, and personal report, you can see how many hours were planned and actually booked per month. The planned hours are shown in the background as a curve (with mouseover info) for comparison.